01 · NextUp SoCal · Virtual Event
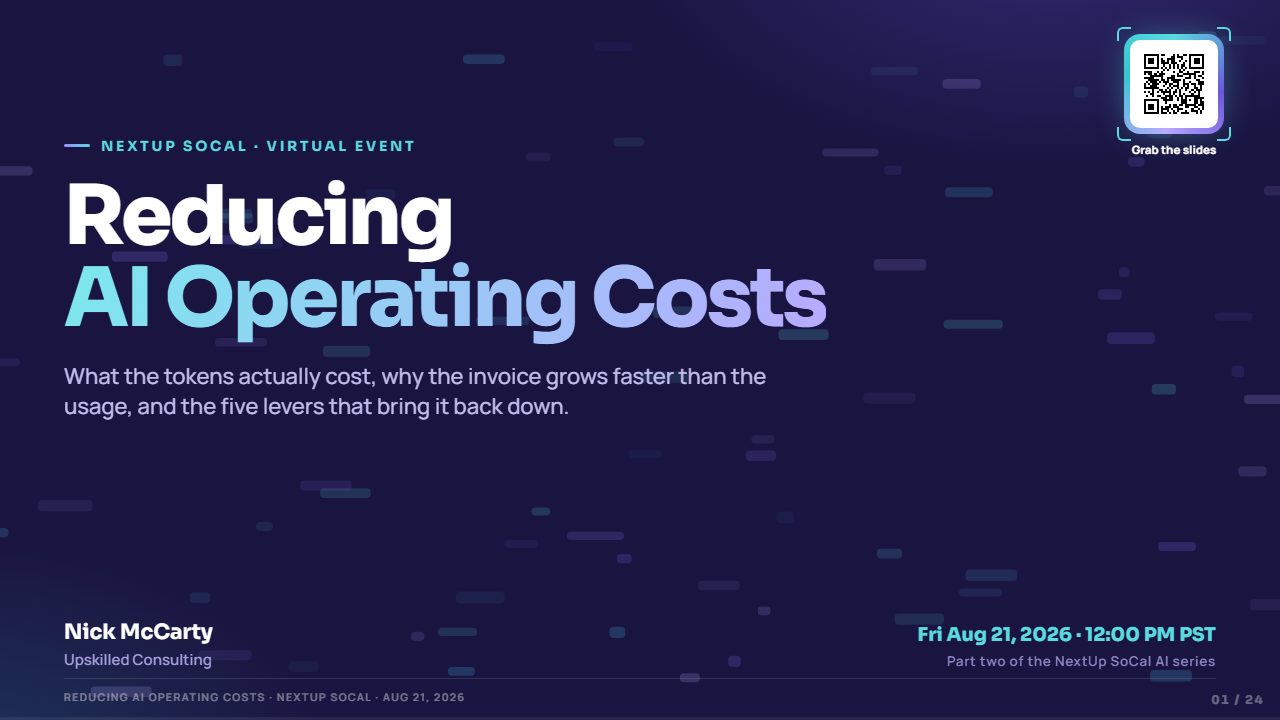
Reducing AI Operating Costs
What the tokens actually cost, why the invoice grows faster than the usage, and the five levers that bring it back down.
 Tap to enlarge
The full deck, laid out to read on a phone. Nick McCarty, Upskilled Consulting.
What the tokens actually cost, why the invoice grows faster than the usage, and the five levers that bring it back down.
Tap to enlarge
 Tap to enlarge
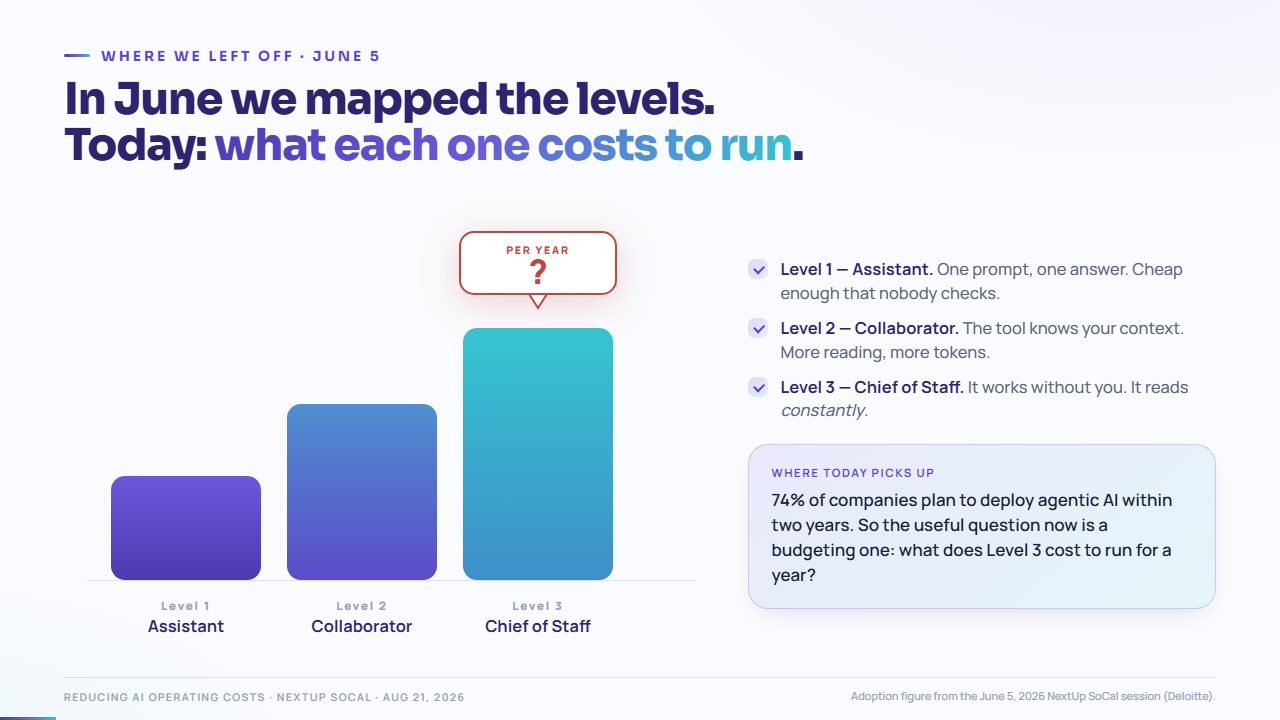
Adoption figure from the June 5, 2026 NextUp SoCal session (Deloitte).
 Tap to enlarge
 Tap to enlarge
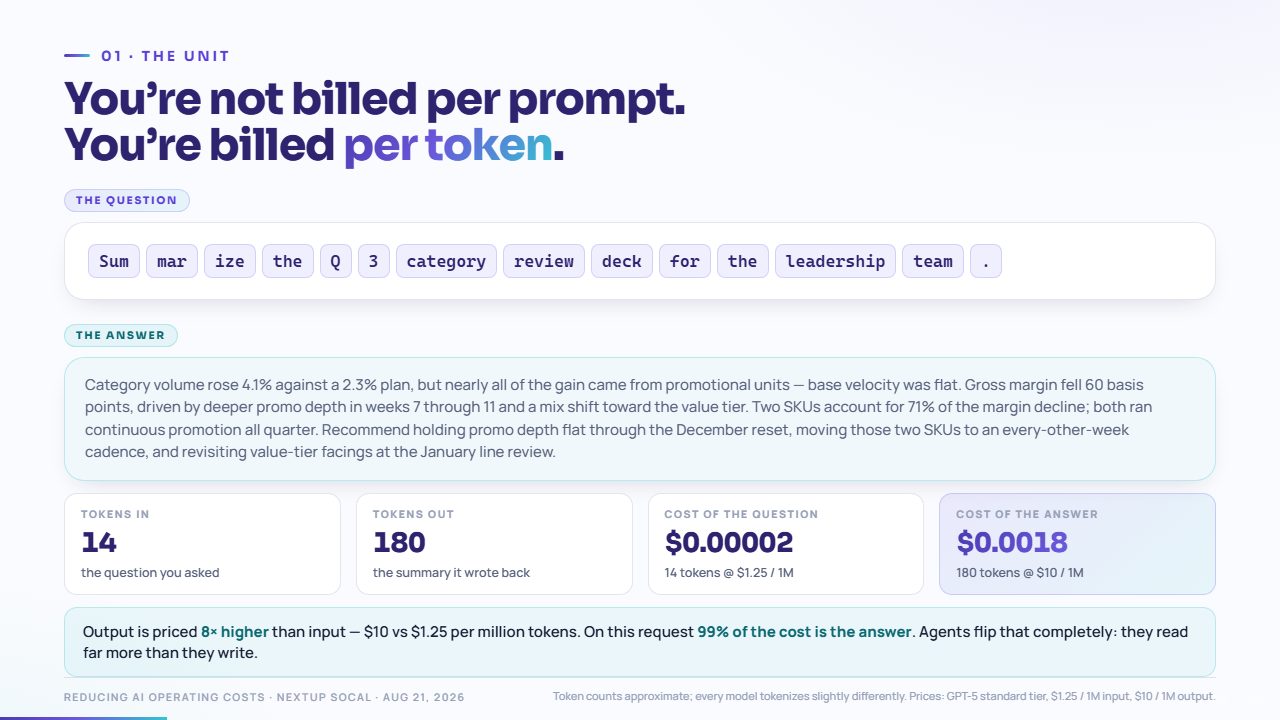
Token counts approximate; every model tokenizes slightly differently. Prices: GPT-5 standard tier, $1.25 / 1M input, $10 / 1M output.
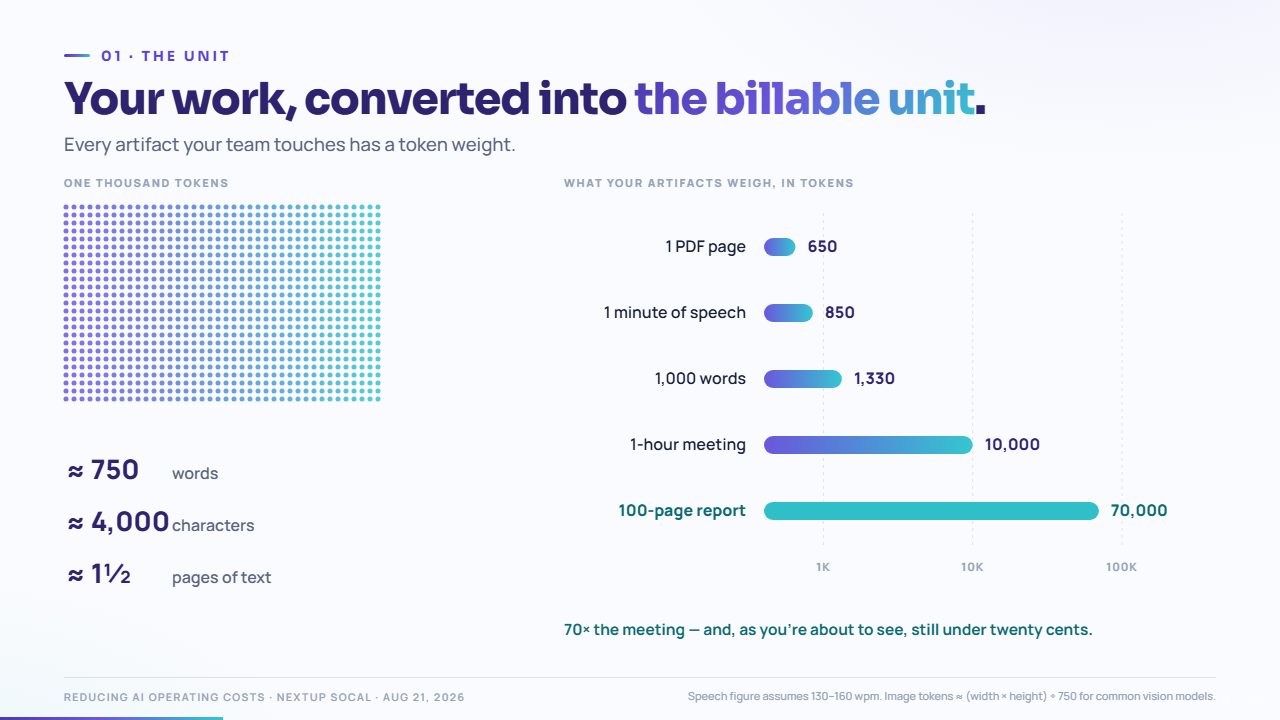
Every artifact your team touches has a token weight.
 Tap to enlarge
Speech figure assumes 130–160 wpm. Image tokens ≈ (width × height) ÷ 750 for common vision models.
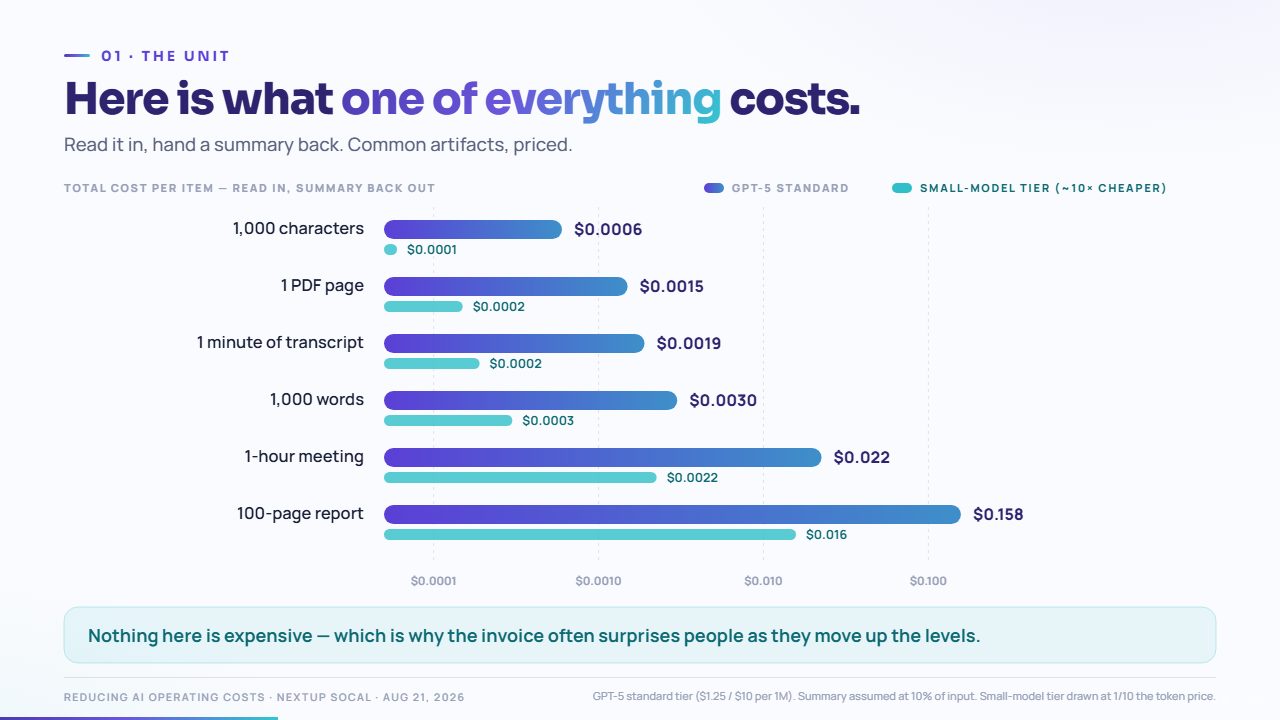
Read it in, hand a summary back. Common artifacts, priced.
 Tap to enlarge
GPT-5 standard tier ($1.25 / $10 per 1M). Summary assumed at 10% of input. Small-model tier drawn at 1/10 the token price.
 Tap to enlarge
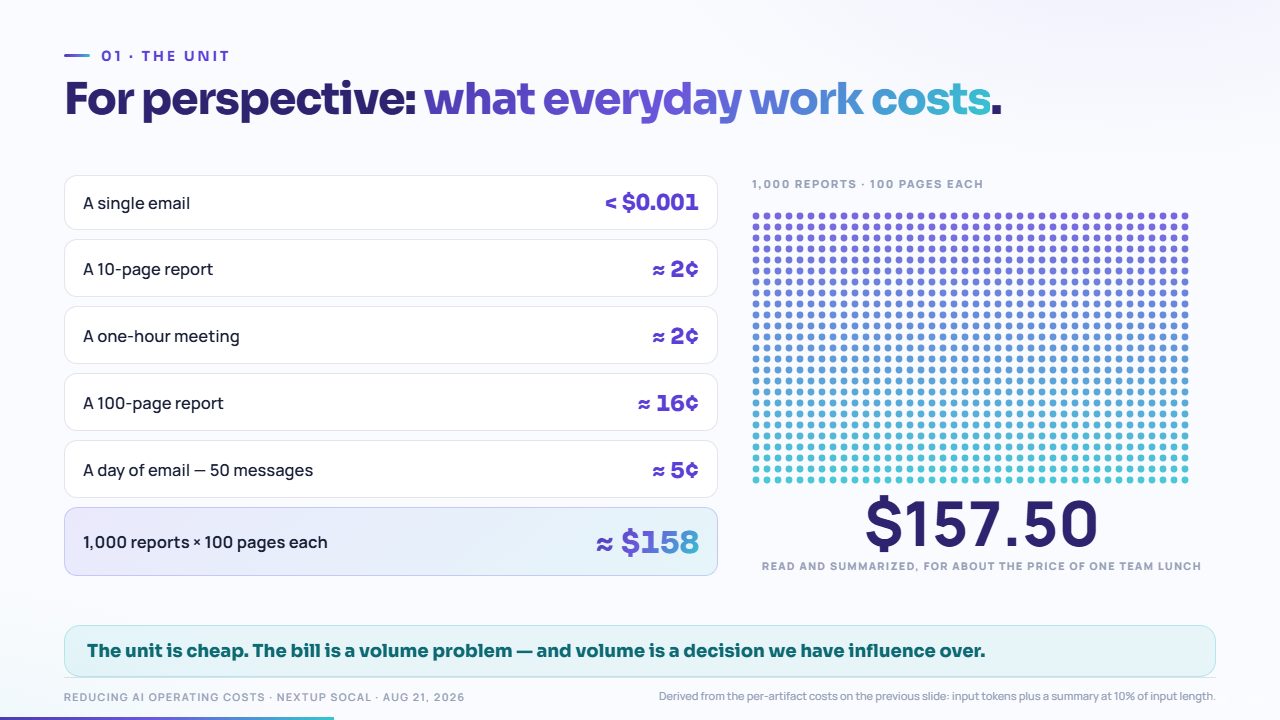
Derived from the per-artifact costs on the previous slide: input tokens plus a summary at 10% of input length.
 Tap to enlarge
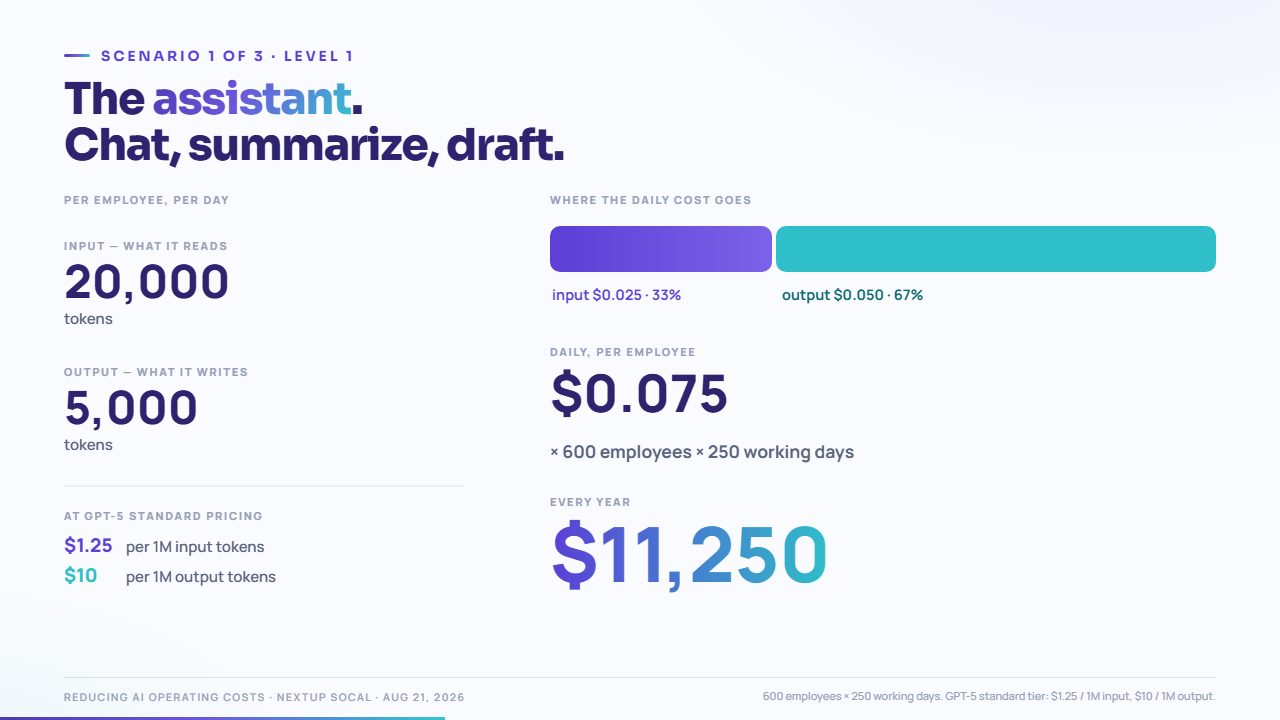 Tap to enlarge
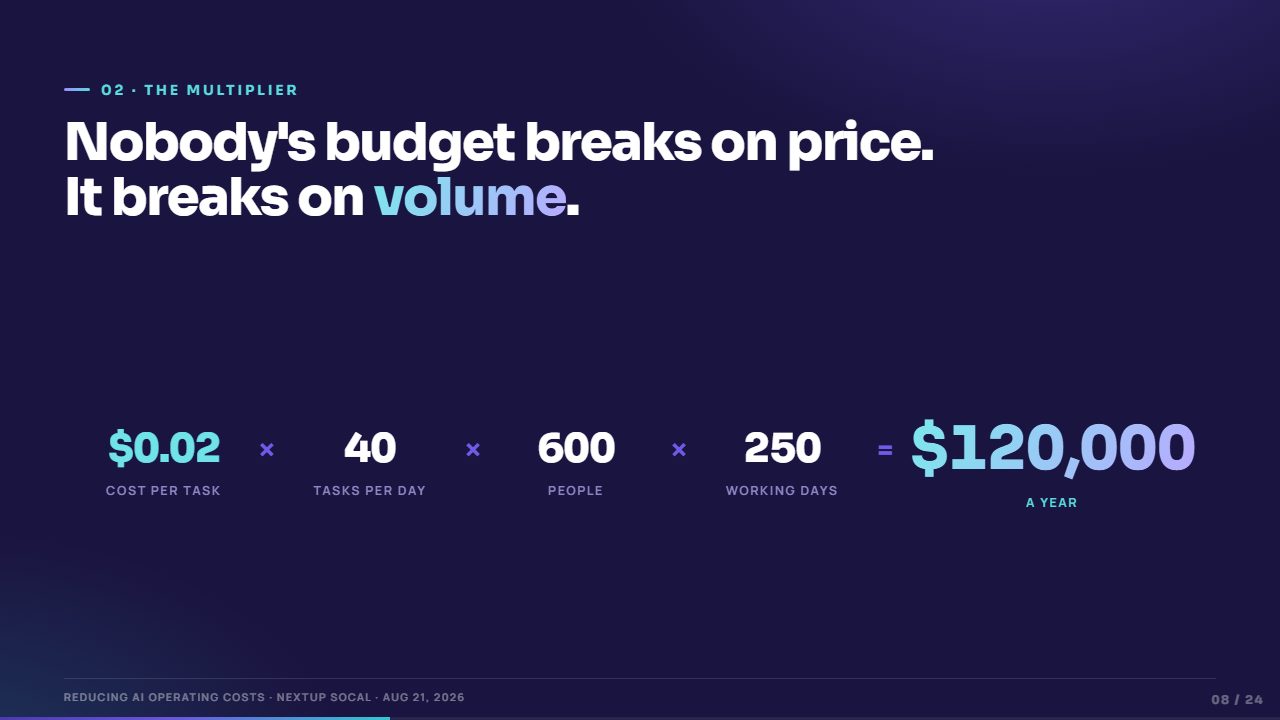
600 employees × 250 working days. GPT-5 standard tier: $1.25 / 1M input, $10 / 1M output.
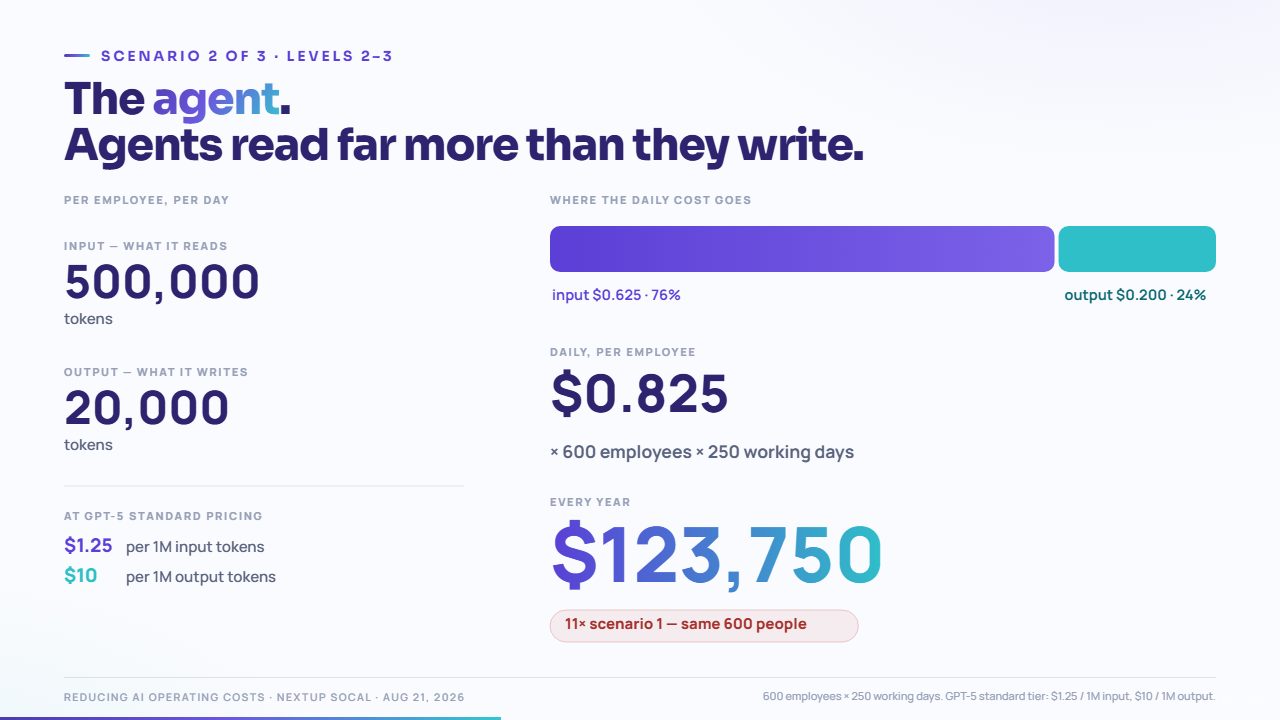 Tap to enlarge
600 employees × 250 working days. GPT-5 standard tier: $1.25 / 1M input, $10 / 1M output.
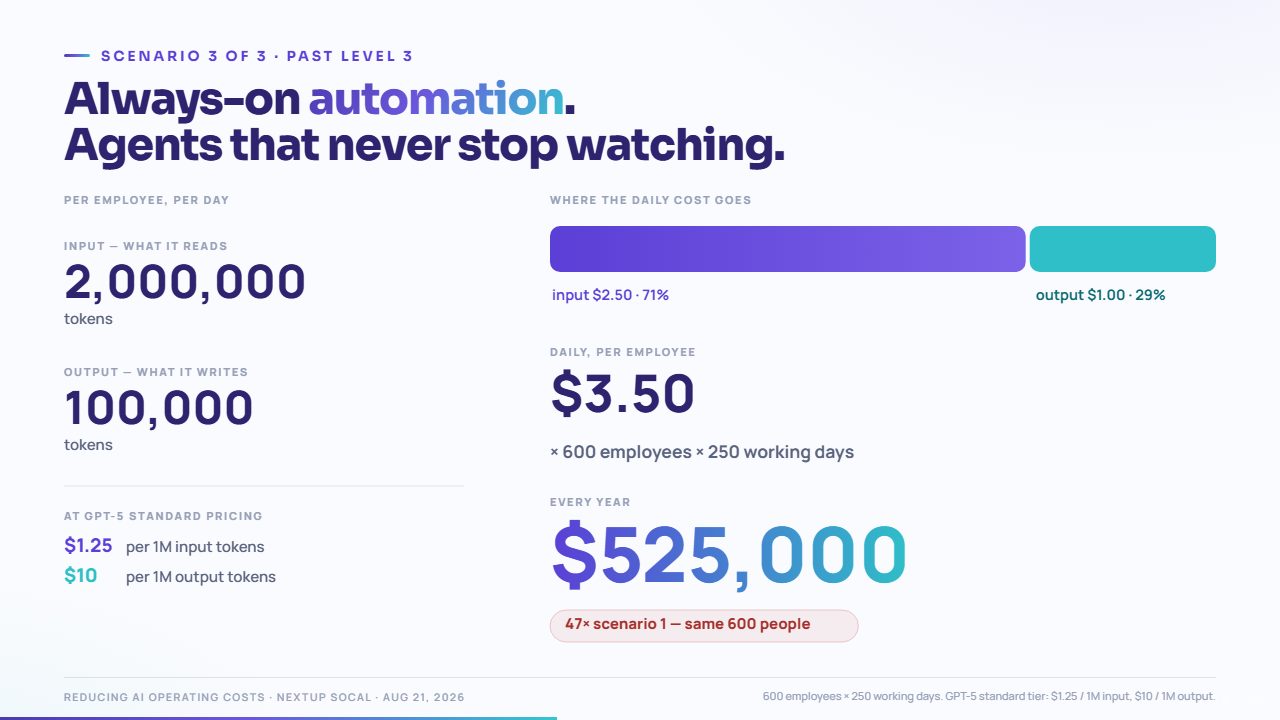 Tap to enlarge
600 employees × 250 working days. GPT-5 standard tier: $1.25 / 1M input, $10 / 1M output.
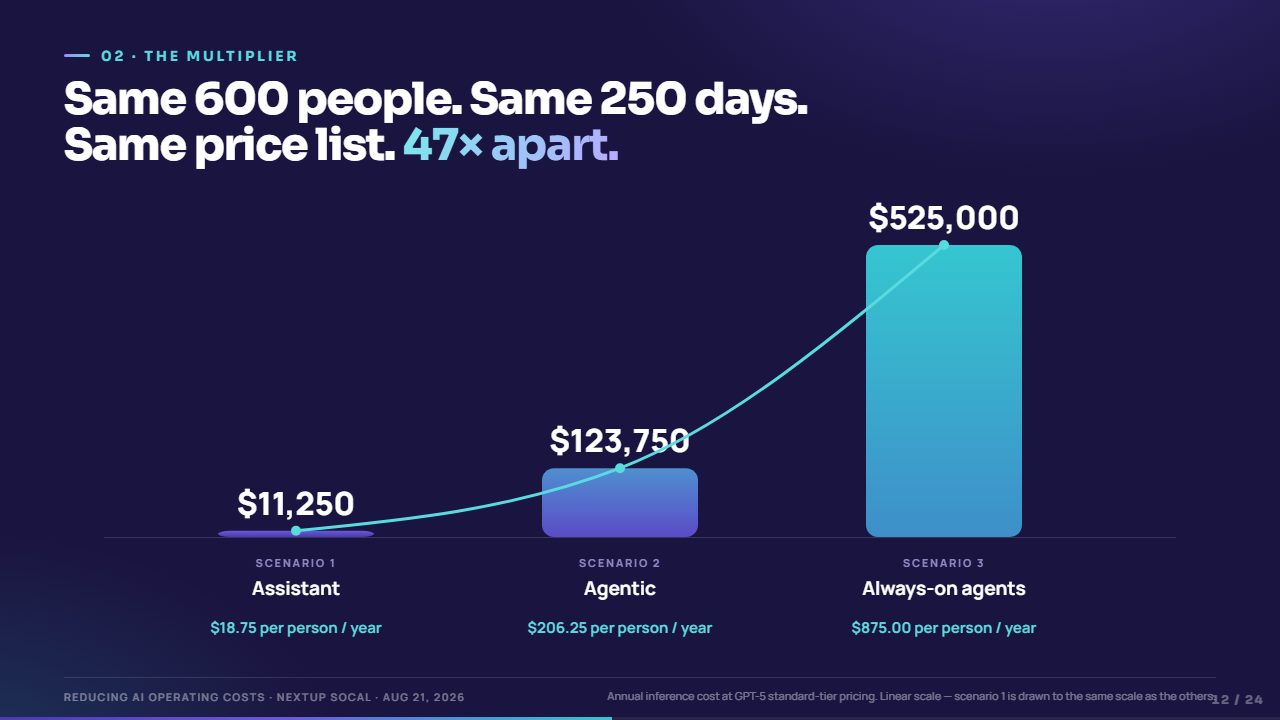 Tap to enlarge
Annual inference cost at GPT-5 standard-tier pricing. Linear scale — scenario 1 is drawn to the same scale as the others.
 Tap to enlarge
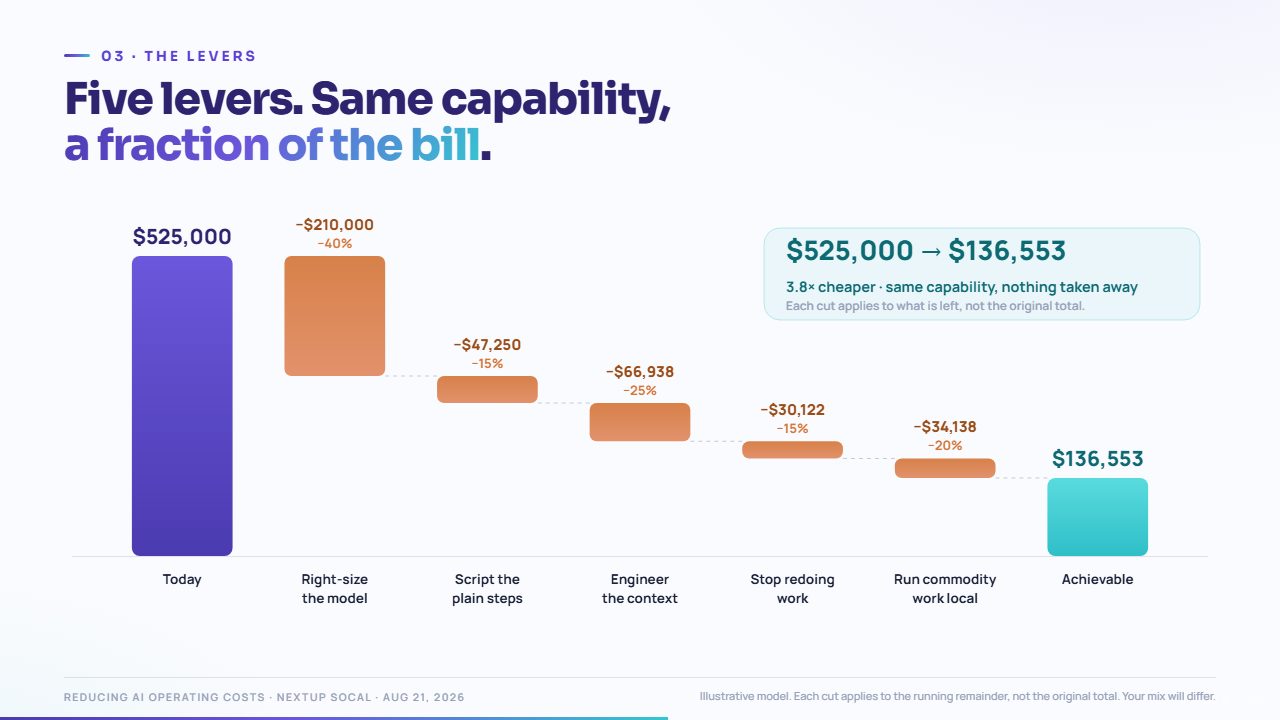
Illustrative model. Each cut applies to the running remainder, not the original total. Your mix will differ.
 Tap to enlarge
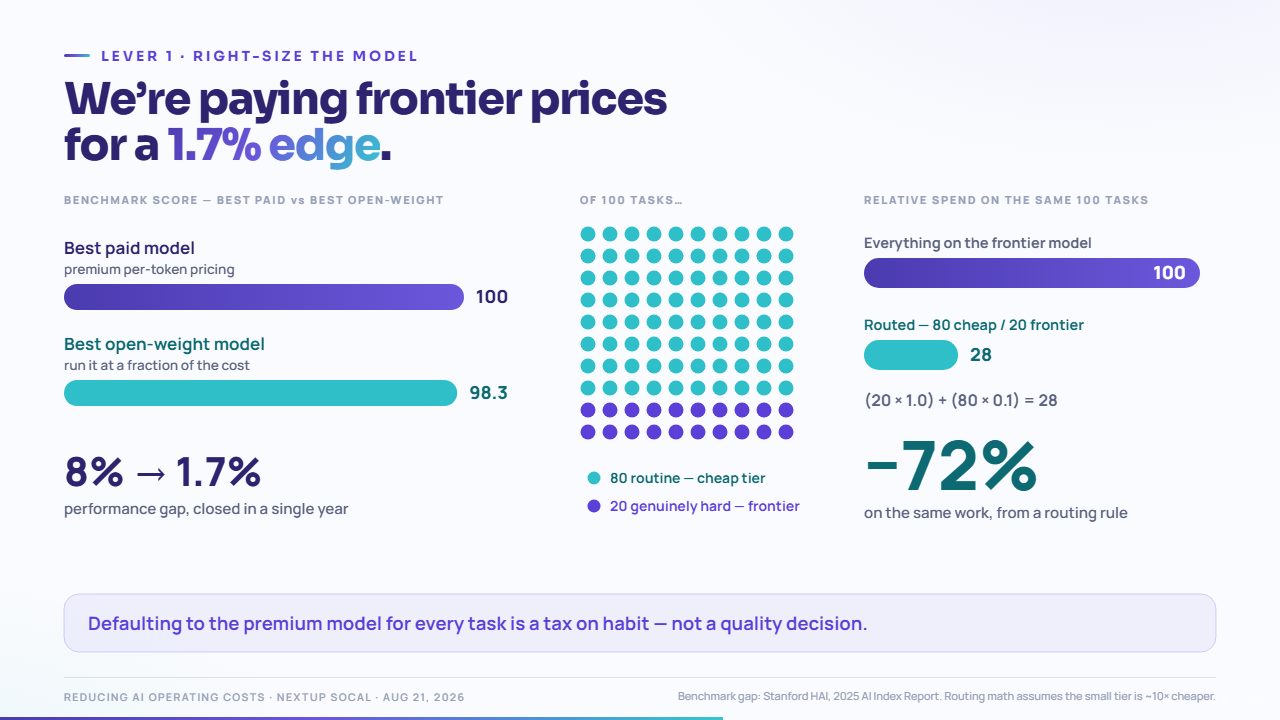
Benchmark gap: Stanford HAI, 2025 AI Index Report. Routing math assumes the small tier is ~10× cheaper.
 Tap to enlarge
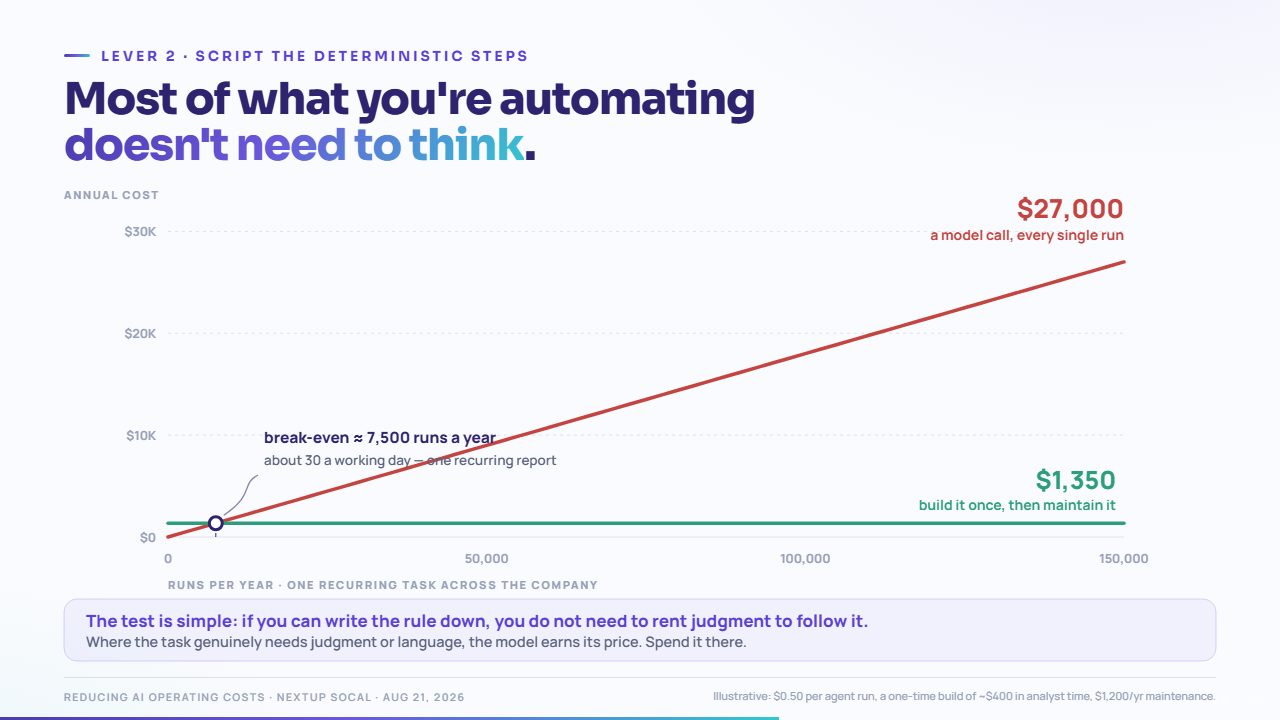
Illustrative: $0.50 per agent run, a one-time build of ~$400 in analyst time, $1,200/yr maintenance.
 Tap to enlarge
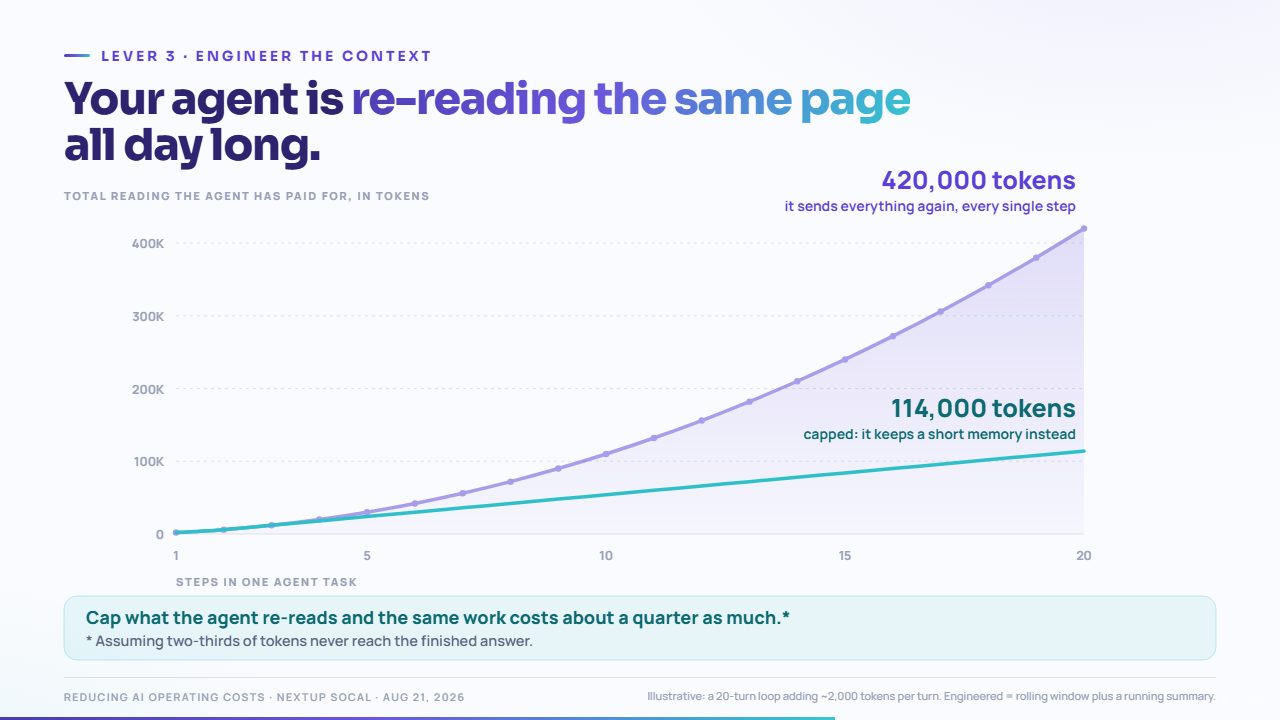
Illustrative: a 20-turn loop adding ~2,000 tokens per turn. Engineered = rolling window plus a running summary.
 Tap to enlarge
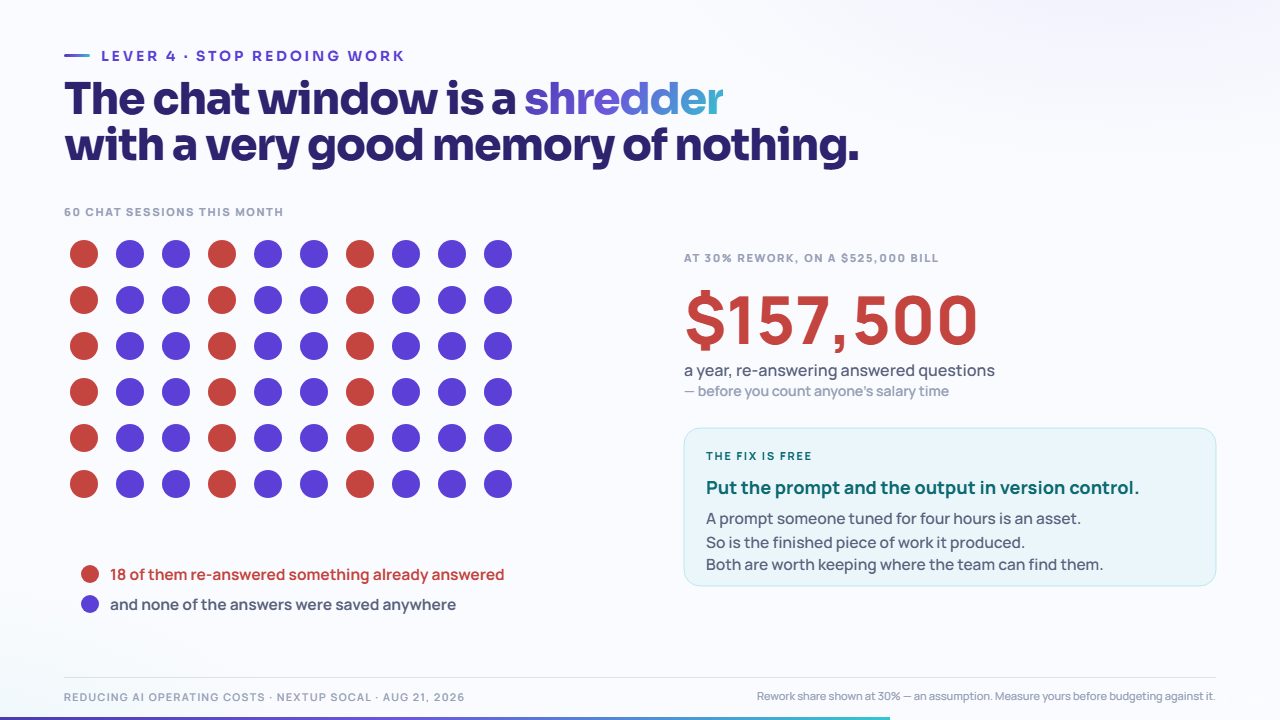
Rework share shown at 30% — an assumption. Measure yours before budgeting against it.
 Tap to enlarge
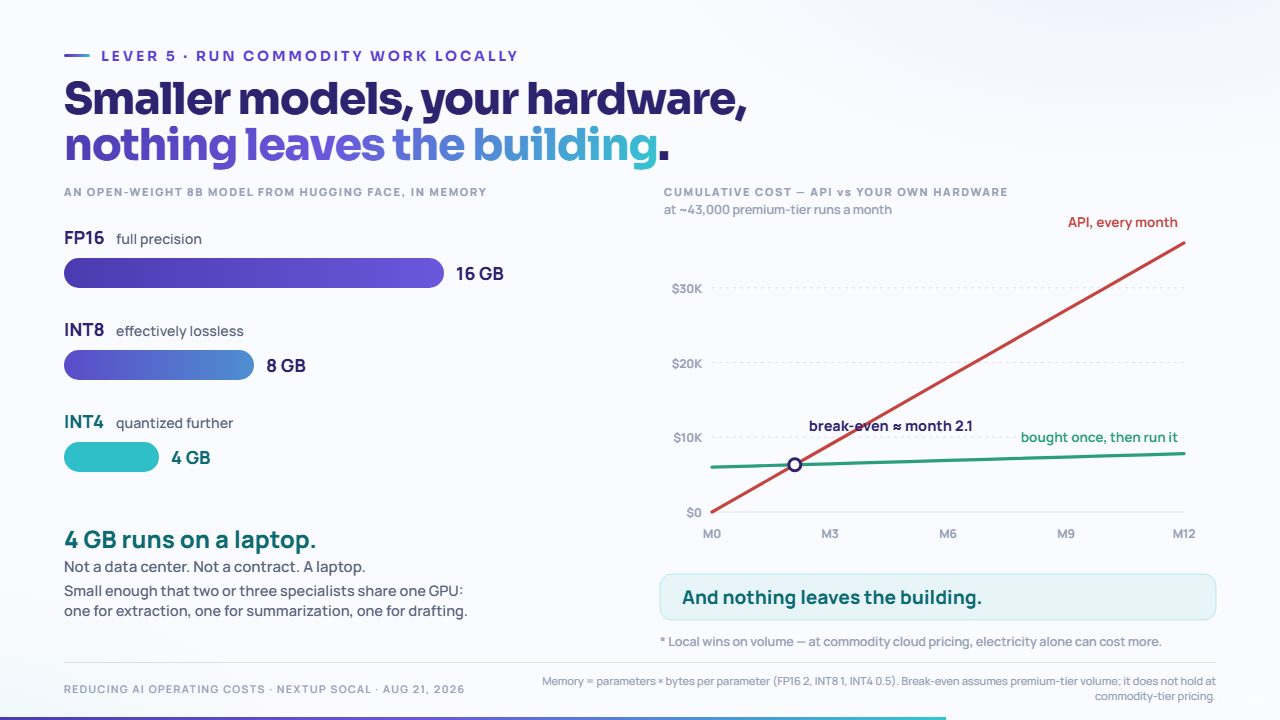
Memory = parameters × bytes per parameter (FP16 2, INT8 1, INT4 0.5). Break-even assumes premium-tier volume; it does not hold at commodity-tier pricing.
 Tap to enlarge
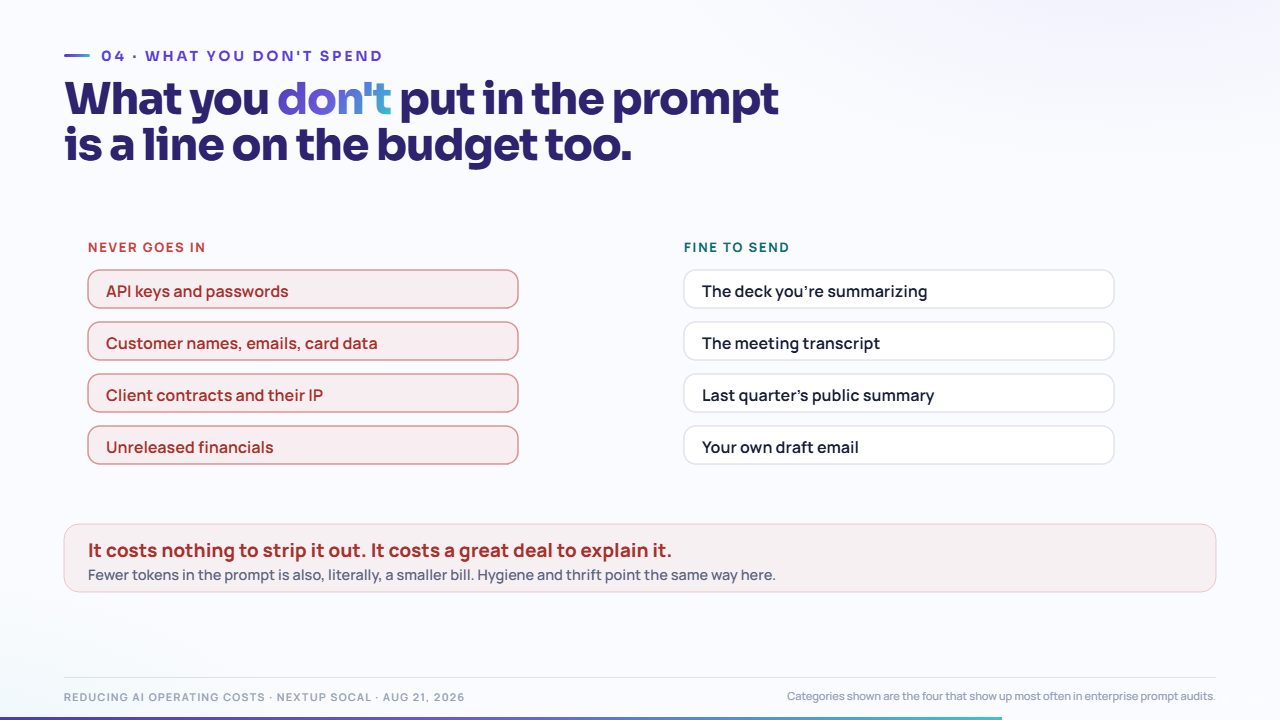
Categories shown are the four that show up most often in enterprise prompt audits.
 Tap to enlarge
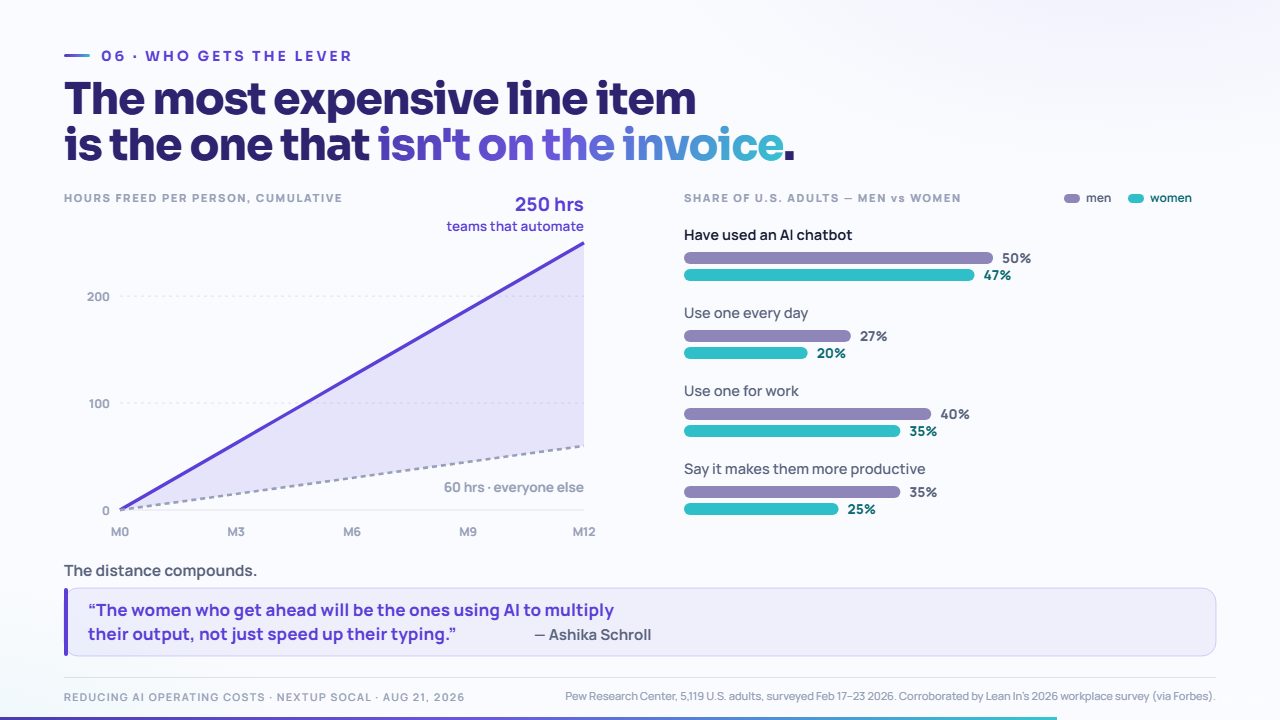
Pew Research Center, 5,119 U.S. adults, surveyed Feb 17–23 2026. Corroborated by Lean In’s 2026 workplace survey (via Forbes).
 Tap to enlarge
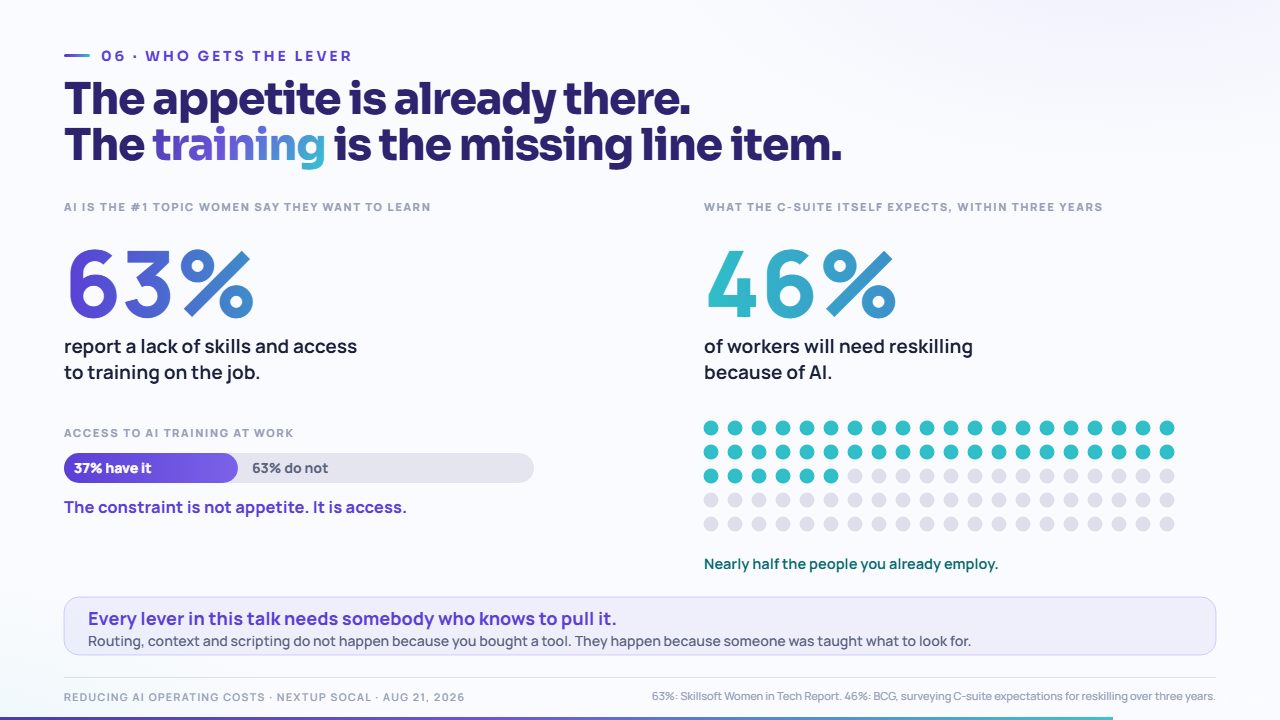
63%: Skillsoft Women in Tech Report. 46%: BCG, surveying C-suite expectations for reskilling over three years.
 Tap to enlarge
 Tap to enlarge
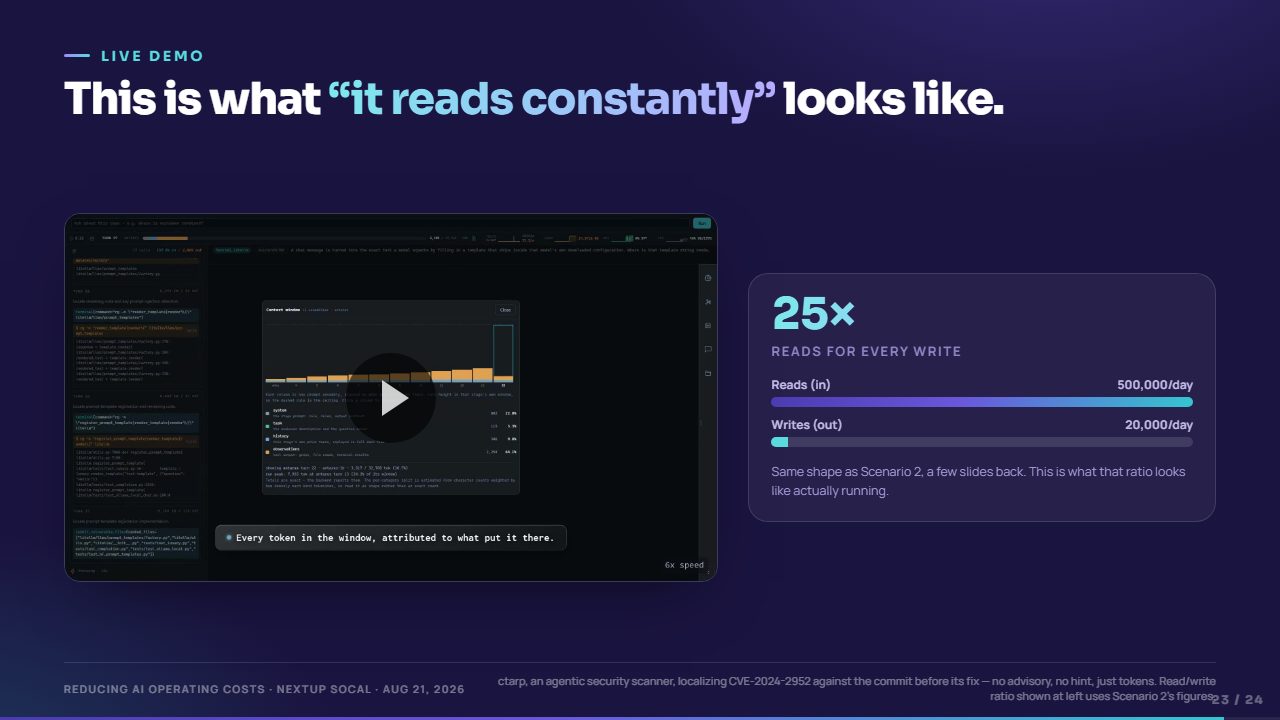
ctarp, an agentic security scanner, localizing CVE-2024-2952 against the commit before its fix — no advisory, no hint, just tokens. Read/write ratio shown at left uses Scenario 2's figures.
 Tap to enlarge